

Article Sidebar
Main Article Content
Abstract
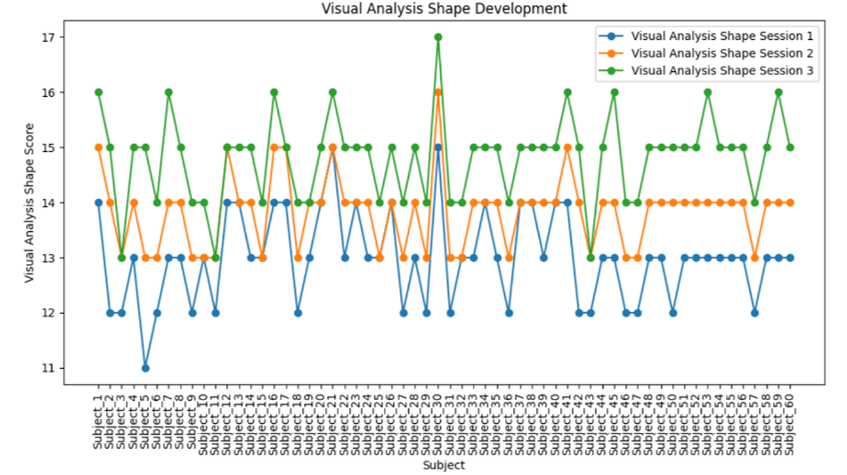
The effectiveness of visualization tools in enhancing mathematical visual thinking skills, particularly for quadratic functions, remains underexplored. This study evaluates the impact of quadratic graph visualization worksheets on these skills using Time-Series and PCA Clustering approaches. The research involved 60 first-year Calculus students focusing on quadratic functions. A quantitative methodology was applied, with Time-Series analysis tracking score changes over time and PCA Clustering grouping students based on improvement patterns. Results revealed significant variations in score changes after using the worksheets. The highest positive score change reached 19 points, while PCA Clustering identified three student groups: minimal or negative changes (Cluster 0), moderate improvements (Cluster 1), and significant increases (Cluster 2). The findings demonstrate the potential of quadratic graph visualization worksheets to improve mathematical visual thinking skills, though the degree of enhancement varies across individuals. This research highlights the need for instructional tools that accommodate diverse learning trajectories and provides insights into the effectiveness of graph-based methods in mathematics education. It also advocates for refined analytical approaches in evaluating student learning outcomes.
Keywords
Article Details
Copyright (c) 2025 Ria Noviana Agus, Rina Oktaviyanthi, Usep Sholahudin

This work is licensed under a Creative Commons Attribution 4.0 International License.
This journal provides immediate open access to its content on the principle that making research freely available to the public supports a greater global exchange of knowledge.
All articles published Open Access will be immediately and permanently free for everyone to read and download. We are continuously working with our author communities to select the best choice of license options, Creative Commons Attribution-ShareAlike (CC BY-NC-SA).
References
- Alqahtani, A., Ali, M., Xie, X., & Jones, M. W. (2021). Deep time-series clustering: A review. Electronics, 10(23), 3001. https://doi.org/10.3390/electronics10233001
- Alrammal, M., Dimitrios, X., & Munir, N. (2022). Machine learning with python. In D. Xanthidis, C. Manolas, O. K. Xanthidou & H. I. Wang (Eds.), Handbook of Computer Programming with Python, (pp. 409–448). Routledge. https://doi.org/10.1201/9781003139010-10
- Ariens, S., Ceulemans, E., & Adolf, J. K. (2020). Time series analysis of intensive longitudinal data in psychosomatic research: A methodological overview. Journal of Psychosomatic Research, 137, 110191. https://doi.org/10.1016/j.jpsychores.2020.110191
- Arnheim, R. (2020). Visual Thinking. University of California Press. https://www.ucpress.edu/books/visual-thinking/paper
- Banda, H. J., & Nzabahimana, J. (2023). The impact of physics education technology (PhET) interactive simulation-based learning on motivation and academic achievement among malawian physics students. Journal of Science Education and Technology, 32(1), 127–141. https://doi.org/10.1007/s10956-022-10010-3
- Barkley, E. F., & Major, C. H. (2020). Student engagement techniques: a handbook for college faculty. 416. Jossey-Bass.
- Bond, M., Buntins, K., Bedenlier, S., Zawacki-Richter, O., & Kerres, M. (2020). Mapping research in student engagement and educational technology in higher education: a systematic evidence map. International Journal of Educational Technology in Higher Education, 17(1), 1–30. https://doi.org/10.1186/S41239-019-0176-8
- Cai, S., Liu, C., Wang, T., Liu, E., & Liang, J. C. (2021). Effects of learning physics using Augmented Reality on students’ self-efficacy and conceptions of learning. British Journal of Educational Technology, 52(1), 235–251. https://doi.org/10.1111/bjet.13020
- Chaiyarat, K. (2024). Enhancing creative problem solving and learning motivation in social studies classrooms with gamified cooperative learning. Thinking Skills and Creativity, 54, 101616. https://doi.org/10.1016/J.TSC.2024.101616
- Chan, S. W., Looi, C. K., Ho, W. K., & Kim, M. S. (2022). Tools and approaches for integrating computational thinking and mathematics: A scoping review of current empirical studies. Journal of Educational Computing Research, 60(8), 2036–2080. https://doi.org/10.1177/07356331221098793
- Chang, W., Ji, X., Liu, Y., Xiao, Y., Chen, B., Liu, H., & Zhou, S. (2020). Analysis of university students’ behavior based on a fusion k-means clustering algorithm. Applied Sciences, 10(18), 6566. https://doi.org/10.3390/app10186566
- Chinaka, T. W. (2021). The effect of PhET simulation vs. phenomenon-based experiential learning on students’ integration of motion along two independent axes in projectile motion. African Journal of Research in Mathematics, Science and Technology Education, 25(2), 185–196. https://doi.org/10.1080/18117295.2021.1969739
- Deng, Z., Chen, S., Schreck, T., Deng, D., Tang, T., Xu, M., Weng, D., & Wu, Y. (2024). Visualizing large-scale spatial time series with geochron. IEEE Transactions on Visualization and Computer Graphics, 30(1), 1194–1204. https://doi.org/10.1109/TVCG.2023.3327162
- Diab, H., Daher, W., Rayan, B., Issa, N., & Rayan, A. (2024). Transforming science education in elementary schools: The power of phet simulations in enhancing student learning. Multimodal Technologies and Interaction, 8(11), 105. https://doi.org/10.3390/mti8110105
- Dorji, T., Subba, S., & Zangmo, T. (2024). De-mystifying the influence of PhET simulation on engagement, satisfaction, and academic achievement of bhutanese students in the physics classroom. Journal of Science Education and Technology, 33, 892-909. https://doi.org/10.1007/S10956-024-10131-X
- Elsayed, S. A., & Al-Najrani, H. I. (2021). Effectiveness of the augmented reality on improving the visual thinking in mathematics and academic motivation for middle school students. Eurasia Journal of Mathematics, Science and Technology Education, 17(8). https://doi.org/10.29333/ejmste/11069
- Gatto, S., Gaggi, O., Grosset, L., & Fovino, L. G. N. (2024). Accessible mathematics: Representation of functions through sound and touch. IEEE Access, 12, 121552-121569. https://doi.org/10.1109/ACCESS.2024.3448509
- Göbel, L. (2021). Technology-Assisted Guided Discovery to Support Learning. https://doi.org/10.1007/978-3-658-32637-1
- Guo, D., McTigue, E. M., Matthews, S. D., & Zimmer, W. (2020). The impact of visual displays on learning across the disciplines: A systematic review. Educational Psychology Review, 32(3), 627–656. https://doi.org/10.1007/s10648-020-09523-3
- Güçler, D., Ekmekçi, N., Yaylı, Y., & Helvacı, M. (2022). Obtaining the parametric equation of the curve of the sun’s apparent movement by using quaternions. Universal Journal of Mathematics and Applications, 5(2), 42-50. https://doi.org/10.32323/ujma.1091832
- Hamami, Y., & Morris, R. L. (2020). Philosophy of mathematical practice: a primer for mathematics educators. ZDM, 52(6), 1113–1126. https://doi.org/10.1007/S11858-020-01159-5
- Hawes, Z., & Ansari, D. (2020). What explains the relationship between spatial and mathematical skills? A review of evidence from brain and behavior. Psychonomic Bulletin and Review, 27(3), 465–482. https://doi.org/10.3758/S13423-019-01694-7
- Heilporn, G., Lakhal, S., & Bélisle, M. (2021). An examination of teachers’ strategies to foster student engagement in blended learning in higher education. International Journal of Educational Technology in Higher Education, 18(1), 1–25. https://doi.org/10.1186/S41239-021-00260-3
- Hirose, M., & Creswell, J. W. (2023). Applying core quality criteria of mixed methods research to an empirical study. Journal of Mixed Methods Research, 17(1), 12–28. https://doi.org/10.1177/15586898221086346
- Howell, R. A. (2021). Engaging students in education for sustainable development: The benefits of active learning, reflective practices and flipped classroom pedagogies. Journal of Cleaner Production, 325, 129318. https://doi.org/10.1016/J.JCLEPRO.2021.129318
- Hsiao, P. W., & Su, C. H. (2021). A Study on the impact of steam education for sustainable development courses and its effects on student motivation and learning. Sustainability, 13(7), 3772. https://doi.org/10.3390/SU13073772
- Huang, Y. M., Silitonga, L. M., & Wu, T. T. (2022). Applying a business simulation game in a flipped classroom to enhance engagement, learning achievement, and higher-order thinking skills. Computers & Education, 183, 104494. https://doi.org/10.1016/j.compedu.2022.104494
- Iatrellis, O., Savvas, I., Fitsilis, P., & Gerogiannis, V. C. (2021). A two-phase machine learning approach for predicting student outcomes. Education and Information Technologies, 26(1), 69–88. https://doi.org/10.1007/S10639-020-10260-X
- Kahu, E. R. (2013). Framing student engagement in higher education. Studies in Higher Education, 38(5), 758–773. https://doi.org/10.1080/03075079.2011.598505
- Khandare, A., Agarwal, N., Bodhankar, A., Kulkarni, A., Mane, I. (2023). Analysis of python libraries for artificial intelligence. In V.E. Balas, V. B. Semwal, A. Khandare (Eds.), Intelligent Computing and Networking. Lecture Notes in Networks and Systems. Springer, Singapore. https://doi.org/10.1007/978-981-99-0071-8_13
- Kohen, Z., Amram, M., Dagan, M., & Miranda, T. (2022). Self-efficacy and problem-solving skills in mathematics: the effect of instruction-based dynamic versus static visualization. Interactive Learning Environments, 30(4), 759–778. https://doi.org/10.1080/10494820.2019.1683588
- Kohnle, A., Ainsworth, S. E., & Passante, G. (2020). Sketching to support visual learning with interactive tutorials. Physical Review Physics Education Research, 16(2). https://doi.org/10.1103/PHYSREVPHYSEDUCRES.16.020139
- Koskinen, A., McMullen, J., Ninaus, M., & Kiili, K. (2023). Does the emotional design of scaffolds enhance learning and motivational outcomes in game-based learning? Journal of Computer Assisted Learning, 39(1), 77–93. https://doi.org/10.1111/jcal.12728
- Lee, S. W. Y., Shih, M., Liang, J. C., & Tseng, Y. C. (2021). Investigating learners’ engagement and science learning outcomes in different designs of participatory simulated games. British Journal of Educational Technology, 52(3), 1197–1214. https://doi.org/10.1111/bjet.13067
- Li, J., & Xue, E. (2023). Dynamic interaction between student learning behaviour and learning environment: Meta-analysis of student engagement and its influencing factors. Behavioral Sciences, 13(1), 59. https://doi.org/10.3390/bs13010059
- Li, X., Zhang, Y., Cheng, H., Zhou, F., & Yin, B. (2021). An Unsupervised Ensemble Clustering Approach for the Analysis of Student Behavioral Patterns. IEEE Access, 9, 7076–7091. https://doi.org/10.1109/ACCESS.2021.3049157
- Liu, Z., Tang, Q., Ouyang, F., Long, T., & Liu, S. (2024). Profiling students’ learning engagement in MOOC discussions to identify learning achievement: An automated configurational approach. Computers & Education, 219, 105109. https://doi.org/10.1016/j.compedu.2024.105109
- López, S. S., & Vivier, L. (2023). Local visualization of functions in work on optimization. Teaching Mathematics and Its Applications: An International Journal of the IMA, 42(4), 305–324. https://doi.org/10.1093/teamat/hrac022
- Mainali, B. (2021). Representation in Teaching and Learning Mathematics. International Journal of Education in Mathematics, Science and Technology, 9(1), 1–21. https://doi.org/10.46328/ijemst.1111
- Martins, R., Viseu, F., & Rocha, H. (2023). Functional thinking: A study with 10th-grade students. Education Sciences, 13(4), 335. https://doi.org/10.3390/educsci13040335
- Mohamed Nafuri, A. F., Sani, N. S., Zainudin, N. F. A., Rahman, A. H. A., & Aliff, M. (2022). Clustering Analysis for Classifying Student Academic Performance in Higher Education. Applied Sciences, 12(19), 9467. https://doi.org/10.3390/app12199467
- Morgan, G. A., Gliner, J. A., & Harmon, R. J. (2000). Quasi-experimental designs. Journal of the American Academy of Child and Adolescent Psychiatry, 39(6), 794. https://doi.org/10.1097/00004583-200006000-00020
- Moubayed, A., Injadat, M., Shami, A., & Lutfiyya, H. (2020). Student engagement level in an e-learning environment: Clustering using k-means. American Journal of Distance Education, 34(2), 137–156. https://doi.org/10.1080/08923647.2020.1696140
- Namoun, A., & Alshanqiti, A. (2020). Predicting student performance using data mining and learning analytics techniques: A systematic literature review. Applied Sciences, 11(1), 237. https://doi.org/10.3390/app11010237
- Odutayo, A. O., & Fonseca, K. (2024). Making quadratic functions interesting: Students teams-achievement division instructional strategy. Eurasia Journal of Mathematics, Science and Technology Education, 20(1). https://doi.org/10.29333/ejmste/14092
- Oktaviyanthi, R., & Agus, R. N. (2023). Evaluating graphing quadratic worksheet on visual thinking classification: A confirmatory analysis. Infinity Journal, 12(2), 207–224. https://doi.org/10.22460/infinity.v12i2.p207-224
- Oktaviyanthi, R., & Sholahudin, U. (2023). PhET assisted trigonometric worksheet for students’ trigonometric adaptive thinking. Mosharafa: Jurnal Pendidikan Matematika, 12(2), 229–242. https://doi.org/10.31980/MOSHARAFA.V12I2.779
- Özsoy, V., & Saribas, S. (2021). Developing visual literacy skills in teacher education: Different ways of looking at the visual images. Educational Policy Analysis and Strategic Research, 16(3), 67–88. https://doi.org/10.29329/epasr.2021.373.5
- Presmeg, N. (2020). Visualization and learning in mathematics education. In S. Lerman (Eds.), Encyclopedia of Mathematics Education (pp. 900–904). Springer, Cham. https://doi.org/10.1007/978-3-030-15789-0_161
- Reichardt, C. S., Storage, D., & Abraham, D. (2023). Quasi-Experimental Research. In A. L. Nichols & J. Edlund (Eds.), The Cambridge Handbook of Research Methods and Statistics for the Social and Behavioral Sciences (pp. 292–313). Cambridge University Press. https://doi.org/10.1017/9781009010054.015
- Ritchhart, R.., & Church, M. (2020). The power of making thinking visible: practices to engage and empower all learners. Jossey-Bass.
- Rolfes, T., Roth, J., & Schnotz, W. (2020). learning the concept of function with dynamic visualizations. Frontiers in Psychology, 11, 505588. https://doi.org/10.3389/fpsyg.2020.00693
- Salame, I. I., & Makki, J. (2021). Examining the use of PhET simulations on students’ attitudes and learning in general chemistry II. Interdisciplinary Journal of Environmental and Science Education, 17(4). https://doi.org/10.21601/ijese/10966
- Schlegel, U., & Keim, D. A. (2021, October 24-25). Time series model attribution visualizations as explanations [Paper presentation]. IEEE Workshop on TRust and EXpertise in Visual Analytics (TREX), New Orleans, LA, USA. https://doi.org/10.1109/TREX53765.2021.00010
- Staton, D. (2023). Visual Thinking: The Hidden Gifts of People Who Think in Pictures, Patterns, and Abstractions, by Temple Grandin, with Betsy Lerner. Visual Communication Quarterly, 30(2), 118–119. https://doi.org/10.1080/15551393.2023.2199047
- Teófilo De Sousa, R., Régis, F., & Alves, V. (2022). Quadratic functions and PhET: An investigation from the perspective of the theory of figural concepts. Contemporary Mathematics and Science Education, 3(1). https://doi.org/10.30935/conmaths/11929
- Tsandilas, T. (2021). StructGraphics: Flexible visualization design through data-agnostic and reusable graphical structures. IEEE Transactions on Visualization and Computer Graphics, 27(2), 315–325. https://doi.org/10.1109/TVCG.2020.3030476
- Tugtekin, U., & Odabasi, H. F. (2022). Do interactive learning environments have an effect on learning outcomes, cognitive load and metacognitive judgments? Education and Information Technologies, 27(5), 7019–7058. https://doi.org/10.1007/S10639-022-10912-0
- van Dulmen, T. H. H., Visser, T. C., Pepin, B., & McKenney, S. (2023). Teacher and student engagement when using learning materials based on the context of cutting-edge chemistry research. Research in Science & Technological Education, 41(4), 1617–1638. https://doi.org/10.1080/02635143.2022.2070147
- Wang, X. M., Hu, Q. N., Hwang, G. J., & Yu, X. H. (2023). Learning with digital technology-facilitated empathy: An augmented reality approach to enhancing students’ flow experience, motivation, and achievement in a biology program. Interactive Learning Environments, 31(10), 6988–7004. https://doi.org/10.1080/10494820.2022.2057549
- Wei, X., Saab, N., & Admiraal, W. (2021). Assessment of cognitive, behavioral, and affective learning outcomes in massive open online courses: A systematic literature review. Computers & Education, 163, 104097. https://doi.org/10.1016/j.compedu.2020.104097
- Wieselmann, J. R., Dare, E. A., Roehrig, G. H., & Ring-Whalen, E. A. (2021). “There are other ways to help besides using the stuff”: Using activity theory to understand dynamic student participation in small group science, technology, engineering, and mathematics activities. Journal of Research in Science Teaching, 58(9), 1281–1319. https://doi.org/10.1002/tea.21710
- Wilkie, K. J. (2021). Seeing quadratics in a new light: Secondary mathematics pre-service teachers’ creation of figural growing patterns. Educational Studies in Mathematics, 106(1), 91–116. https://doi.org/10.1007/S10649-020-09997-6
- Wilkie, K. J. (2024). Coordinating visual and algebraic reasoning with quadratic functions. Mathematics Education Research Journal, 36(1), 33–69. https://doi.org/10.1007/S13394-022-00426-W
- Xu, T. L., de Barbaro, K., Abney, D. H., & Cox, R. F. A. (2020). Finding structure in time: Visualizing and analyzing behavioral time series. Frontiers in Psychology, 11, 521451. https://doi.org/10.3389/fpsyg.2020.01457
- Yang, F. Y., & Wang, H. Y. (2023). Tracking visual attention during learning of complex science concepts with augmented 3D visualizations. Computers & Education, 193, 104659. https://doi.org/10.1016/j.compedu.2022.104659
- Yang, H., Cai, M., Diao, Y., Liu, R., Liu, L., & Xiang, Q. (2023). How does interactive virtual reality enhance learning outcomes via emotional experiences? A structural equation modeling approach. Frontiers in Psychology, 13, 1081372. https://doi.org/10.3389/FPSYG.2022.1081372
- Yohannes, A., & Chen, H. L. (2023). GeoGebra in mathematics education: A systematic review of journal articles published from 2010 to 2020. Interactive Learning Environments, 31(9), 5682–5697. https://doi.org/10.1080/10494820.2021.2016861
- Ziatdinov, R., & Valles, J. R. (2022). Synthesis of modeling, visualization, and programming in geogebra as an effective approach for teaching and learning stem topics. Mathematics, 10(3), 398. https://doi.org/10.3390/math10030398
References
Alqahtani, A., Ali, M., Xie, X., & Jones, M. W. (2021). Deep time-series clustering: A review. Electronics, 10(23), 3001. https://doi.org/10.3390/electronics10233001
Alrammal, M., Dimitrios, X., & Munir, N. (2022). Machine learning with python. In D. Xanthidis, C. Manolas, O. K. Xanthidou & H. I. Wang (Eds.), Handbook of Computer Programming with Python, (pp. 409–448). Routledge. https://doi.org/10.1201/9781003139010-10
Ariens, S., Ceulemans, E., & Adolf, J. K. (2020). Time series analysis of intensive longitudinal data in psychosomatic research: A methodological overview. Journal of Psychosomatic Research, 137, 110191. https://doi.org/10.1016/j.jpsychores.2020.110191
Arnheim, R. (2020). Visual Thinking. University of California Press. https://www.ucpress.edu/books/visual-thinking/paper
Banda, H. J., & Nzabahimana, J. (2023). The impact of physics education technology (PhET) interactive simulation-based learning on motivation and academic achievement among malawian physics students. Journal of Science Education and Technology, 32(1), 127–141. https://doi.org/10.1007/s10956-022-10010-3
Barkley, E. F., & Major, C. H. (2020). Student engagement techniques: a handbook for college faculty. 416. Jossey-Bass.
Bond, M., Buntins, K., Bedenlier, S., Zawacki-Richter, O., & Kerres, M. (2020). Mapping research in student engagement and educational technology in higher education: a systematic evidence map. International Journal of Educational Technology in Higher Education, 17(1), 1–30. https://doi.org/10.1186/S41239-019-0176-8
Cai, S., Liu, C., Wang, T., Liu, E., & Liang, J. C. (2021). Effects of learning physics using Augmented Reality on students’ self-efficacy and conceptions of learning. British Journal of Educational Technology, 52(1), 235–251. https://doi.org/10.1111/bjet.13020
Chaiyarat, K. (2024). Enhancing creative problem solving and learning motivation in social studies classrooms with gamified cooperative learning. Thinking Skills and Creativity, 54, 101616. https://doi.org/10.1016/J.TSC.2024.101616
Chan, S. W., Looi, C. K., Ho, W. K., & Kim, M. S. (2022). Tools and approaches for integrating computational thinking and mathematics: A scoping review of current empirical studies. Journal of Educational Computing Research, 60(8), 2036–2080. https://doi.org/10.1177/07356331221098793
Chang, W., Ji, X., Liu, Y., Xiao, Y., Chen, B., Liu, H., & Zhou, S. (2020). Analysis of university students’ behavior based on a fusion k-means clustering algorithm. Applied Sciences, 10(18), 6566. https://doi.org/10.3390/app10186566
Chinaka, T. W. (2021). The effect of PhET simulation vs. phenomenon-based experiential learning on students’ integration of motion along two independent axes in projectile motion. African Journal of Research in Mathematics, Science and Technology Education, 25(2), 185–196. https://doi.org/10.1080/18117295.2021.1969739
Deng, Z., Chen, S., Schreck, T., Deng, D., Tang, T., Xu, M., Weng, D., & Wu, Y. (2024). Visualizing large-scale spatial time series with geochron. IEEE Transactions on Visualization and Computer Graphics, 30(1), 1194–1204. https://doi.org/10.1109/TVCG.2023.3327162
Diab, H., Daher, W., Rayan, B., Issa, N., & Rayan, A. (2024). Transforming science education in elementary schools: The power of phet simulations in enhancing student learning. Multimodal Technologies and Interaction, 8(11), 105. https://doi.org/10.3390/mti8110105
Dorji, T., Subba, S., & Zangmo, T. (2024). De-mystifying the influence of PhET simulation on engagement, satisfaction, and academic achievement of bhutanese students in the physics classroom. Journal of Science Education and Technology, 33, 892-909. https://doi.org/10.1007/S10956-024-10131-X
Elsayed, S. A., & Al-Najrani, H. I. (2021). Effectiveness of the augmented reality on improving the visual thinking in mathematics and academic motivation for middle school students. Eurasia Journal of Mathematics, Science and Technology Education, 17(8). https://doi.org/10.29333/ejmste/11069
Gatto, S., Gaggi, O., Grosset, L., & Fovino, L. G. N. (2024). Accessible mathematics: Representation of functions through sound and touch. IEEE Access, 12, 121552-121569. https://doi.org/10.1109/ACCESS.2024.3448509
Göbel, L. (2021). Technology-Assisted Guided Discovery to Support Learning. https://doi.org/10.1007/978-3-658-32637-1
Guo, D., McTigue, E. M., Matthews, S. D., & Zimmer, W. (2020). The impact of visual displays on learning across the disciplines: A systematic review. Educational Psychology Review, 32(3), 627–656. https://doi.org/10.1007/s10648-020-09523-3
Güçler, D., Ekmekçi, N., Yaylı, Y., & Helvacı, M. (2022). Obtaining the parametric equation of the curve of the sun’s apparent movement by using quaternions. Universal Journal of Mathematics and Applications, 5(2), 42-50. https://doi.org/10.32323/ujma.1091832
Hamami, Y., & Morris, R. L. (2020). Philosophy of mathematical practice: a primer for mathematics educators. ZDM, 52(6), 1113–1126. https://doi.org/10.1007/S11858-020-01159-5
Hawes, Z., & Ansari, D. (2020). What explains the relationship between spatial and mathematical skills? A review of evidence from brain and behavior. Psychonomic Bulletin and Review, 27(3), 465–482. https://doi.org/10.3758/S13423-019-01694-7
Heilporn, G., Lakhal, S., & Bélisle, M. (2021). An examination of teachers’ strategies to foster student engagement in blended learning in higher education. International Journal of Educational Technology in Higher Education, 18(1), 1–25. https://doi.org/10.1186/S41239-021-00260-3
Hirose, M., & Creswell, J. W. (2023). Applying core quality criteria of mixed methods research to an empirical study. Journal of Mixed Methods Research, 17(1), 12–28. https://doi.org/10.1177/15586898221086346
Howell, R. A. (2021). Engaging students in education for sustainable development: The benefits of active learning, reflective practices and flipped classroom pedagogies. Journal of Cleaner Production, 325, 129318. https://doi.org/10.1016/J.JCLEPRO.2021.129318
Hsiao, P. W., & Su, C. H. (2021). A Study on the impact of steam education for sustainable development courses and its effects on student motivation and learning. Sustainability, 13(7), 3772. https://doi.org/10.3390/SU13073772
Huang, Y. M., Silitonga, L. M., & Wu, T. T. (2022). Applying a business simulation game in a flipped classroom to enhance engagement, learning achievement, and higher-order thinking skills. Computers & Education, 183, 104494. https://doi.org/10.1016/j.compedu.2022.104494
Iatrellis, O., Savvas, I., Fitsilis, P., & Gerogiannis, V. C. (2021). A two-phase machine learning approach for predicting student outcomes. Education and Information Technologies, 26(1), 69–88. https://doi.org/10.1007/S10639-020-10260-X
Kahu, E. R. (2013). Framing student engagement in higher education. Studies in Higher Education, 38(5), 758–773. https://doi.org/10.1080/03075079.2011.598505
Khandare, A., Agarwal, N., Bodhankar, A., Kulkarni, A., Mane, I. (2023). Analysis of python libraries for artificial intelligence. In V.E. Balas, V. B. Semwal, A. Khandare (Eds.), Intelligent Computing and Networking. Lecture Notes in Networks and Systems. Springer, Singapore. https://doi.org/10.1007/978-981-99-0071-8_13
Kohen, Z., Amram, M., Dagan, M., & Miranda, T. (2022). Self-efficacy and problem-solving skills in mathematics: the effect of instruction-based dynamic versus static visualization. Interactive Learning Environments, 30(4), 759–778. https://doi.org/10.1080/10494820.2019.1683588
Kohnle, A., Ainsworth, S. E., & Passante, G. (2020). Sketching to support visual learning with interactive tutorials. Physical Review Physics Education Research, 16(2). https://doi.org/10.1103/PHYSREVPHYSEDUCRES.16.020139
Koskinen, A., McMullen, J., Ninaus, M., & Kiili, K. (2023). Does the emotional design of scaffolds enhance learning and motivational outcomes in game-based learning? Journal of Computer Assisted Learning, 39(1), 77–93. https://doi.org/10.1111/jcal.12728
Lee, S. W. Y., Shih, M., Liang, J. C., & Tseng, Y. C. (2021). Investigating learners’ engagement and science learning outcomes in different designs of participatory simulated games. British Journal of Educational Technology, 52(3), 1197–1214. https://doi.org/10.1111/bjet.13067
Li, J., & Xue, E. (2023). Dynamic interaction between student learning behaviour and learning environment: Meta-analysis of student engagement and its influencing factors. Behavioral Sciences, 13(1), 59. https://doi.org/10.3390/bs13010059
Li, X., Zhang, Y., Cheng, H., Zhou, F., & Yin, B. (2021). An Unsupervised Ensemble Clustering Approach for the Analysis of Student Behavioral Patterns. IEEE Access, 9, 7076–7091. https://doi.org/10.1109/ACCESS.2021.3049157
Liu, Z., Tang, Q., Ouyang, F., Long, T., & Liu, S. (2024). Profiling students’ learning engagement in MOOC discussions to identify learning achievement: An automated configurational approach. Computers & Education, 219, 105109. https://doi.org/10.1016/j.compedu.2024.105109
López, S. S., & Vivier, L. (2023). Local visualization of functions in work on optimization. Teaching Mathematics and Its Applications: An International Journal of the IMA, 42(4), 305–324. https://doi.org/10.1093/teamat/hrac022
Mainali, B. (2021). Representation in Teaching and Learning Mathematics. International Journal of Education in Mathematics, Science and Technology, 9(1), 1–21. https://doi.org/10.46328/ijemst.1111
Martins, R., Viseu, F., & Rocha, H. (2023). Functional thinking: A study with 10th-grade students. Education Sciences, 13(4), 335. https://doi.org/10.3390/educsci13040335
Mohamed Nafuri, A. F., Sani, N. S., Zainudin, N. F. A., Rahman, A. H. A., & Aliff, M. (2022). Clustering Analysis for Classifying Student Academic Performance in Higher Education. Applied Sciences, 12(19), 9467. https://doi.org/10.3390/app12199467
Morgan, G. A., Gliner, J. A., & Harmon, R. J. (2000). Quasi-experimental designs. Journal of the American Academy of Child and Adolescent Psychiatry, 39(6), 794. https://doi.org/10.1097/00004583-200006000-00020
Moubayed, A., Injadat, M., Shami, A., & Lutfiyya, H. (2020). Student engagement level in an e-learning environment: Clustering using k-means. American Journal of Distance Education, 34(2), 137–156. https://doi.org/10.1080/08923647.2020.1696140
Namoun, A., & Alshanqiti, A. (2020). Predicting student performance using data mining and learning analytics techniques: A systematic literature review. Applied Sciences, 11(1), 237. https://doi.org/10.3390/app11010237
Odutayo, A. O., & Fonseca, K. (2024). Making quadratic functions interesting: Students teams-achievement division instructional strategy. Eurasia Journal of Mathematics, Science and Technology Education, 20(1). https://doi.org/10.29333/ejmste/14092
Oktaviyanthi, R., & Agus, R. N. (2023). Evaluating graphing quadratic worksheet on visual thinking classification: A confirmatory analysis. Infinity Journal, 12(2), 207–224. https://doi.org/10.22460/infinity.v12i2.p207-224
Oktaviyanthi, R., & Sholahudin, U. (2023). PhET assisted trigonometric worksheet for students’ trigonometric adaptive thinking. Mosharafa: Jurnal Pendidikan Matematika, 12(2), 229–242. https://doi.org/10.31980/MOSHARAFA.V12I2.779
Özsoy, V., & Saribas, S. (2021). Developing visual literacy skills in teacher education: Different ways of looking at the visual images. Educational Policy Analysis and Strategic Research, 16(3), 67–88. https://doi.org/10.29329/epasr.2021.373.5
Presmeg, N. (2020). Visualization and learning in mathematics education. In S. Lerman (Eds.), Encyclopedia of Mathematics Education (pp. 900–904). Springer, Cham. https://doi.org/10.1007/978-3-030-15789-0_161
Reichardt, C. S., Storage, D., & Abraham, D. (2023). Quasi-Experimental Research. In A. L. Nichols & J. Edlund (Eds.), The Cambridge Handbook of Research Methods and Statistics for the Social and Behavioral Sciences (pp. 292–313). Cambridge University Press. https://doi.org/10.1017/9781009010054.015
Ritchhart, R.., & Church, M. (2020). The power of making thinking visible: practices to engage and empower all learners. Jossey-Bass.
Rolfes, T., Roth, J., & Schnotz, W. (2020). learning the concept of function with dynamic visualizations. Frontiers in Psychology, 11, 505588. https://doi.org/10.3389/fpsyg.2020.00693
Salame, I. I., & Makki, J. (2021). Examining the use of PhET simulations on students’ attitudes and learning in general chemistry II. Interdisciplinary Journal of Environmental and Science Education, 17(4). https://doi.org/10.21601/ijese/10966
Schlegel, U., & Keim, D. A. (2021, October 24-25). Time series model attribution visualizations as explanations [Paper presentation]. IEEE Workshop on TRust and EXpertise in Visual Analytics (TREX), New Orleans, LA, USA. https://doi.org/10.1109/TREX53765.2021.00010
Staton, D. (2023). Visual Thinking: The Hidden Gifts of People Who Think in Pictures, Patterns, and Abstractions, by Temple Grandin, with Betsy Lerner. Visual Communication Quarterly, 30(2), 118–119. https://doi.org/10.1080/15551393.2023.2199047
Teófilo De Sousa, R., Régis, F., & Alves, V. (2022). Quadratic functions and PhET: An investigation from the perspective of the theory of figural concepts. Contemporary Mathematics and Science Education, 3(1). https://doi.org/10.30935/conmaths/11929
Tsandilas, T. (2021). StructGraphics: Flexible visualization design through data-agnostic and reusable graphical structures. IEEE Transactions on Visualization and Computer Graphics, 27(2), 315–325. https://doi.org/10.1109/TVCG.2020.3030476
Tugtekin, U., & Odabasi, H. F. (2022). Do interactive learning environments have an effect on learning outcomes, cognitive load and metacognitive judgments? Education and Information Technologies, 27(5), 7019–7058. https://doi.org/10.1007/S10639-022-10912-0
van Dulmen, T. H. H., Visser, T. C., Pepin, B., & McKenney, S. (2023). Teacher and student engagement when using learning materials based on the context of cutting-edge chemistry research. Research in Science & Technological Education, 41(4), 1617–1638. https://doi.org/10.1080/02635143.2022.2070147
Wang, X. M., Hu, Q. N., Hwang, G. J., & Yu, X. H. (2023). Learning with digital technology-facilitated empathy: An augmented reality approach to enhancing students’ flow experience, motivation, and achievement in a biology program. Interactive Learning Environments, 31(10), 6988–7004. https://doi.org/10.1080/10494820.2022.2057549
Wei, X., Saab, N., & Admiraal, W. (2021). Assessment of cognitive, behavioral, and affective learning outcomes in massive open online courses: A systematic literature review. Computers & Education, 163, 104097. https://doi.org/10.1016/j.compedu.2020.104097
Wieselmann, J. R., Dare, E. A., Roehrig, G. H., & Ring-Whalen, E. A. (2021). “There are other ways to help besides using the stuff”: Using activity theory to understand dynamic student participation in small group science, technology, engineering, and mathematics activities. Journal of Research in Science Teaching, 58(9), 1281–1319. https://doi.org/10.1002/tea.21710
Wilkie, K. J. (2021). Seeing quadratics in a new light: Secondary mathematics pre-service teachers’ creation of figural growing patterns. Educational Studies in Mathematics, 106(1), 91–116. https://doi.org/10.1007/S10649-020-09997-6
Wilkie, K. J. (2024). Coordinating visual and algebraic reasoning with quadratic functions. Mathematics Education Research Journal, 36(1), 33–69. https://doi.org/10.1007/S13394-022-00426-W
Xu, T. L., de Barbaro, K., Abney, D. H., & Cox, R. F. A. (2020). Finding structure in time: Visualizing and analyzing behavioral time series. Frontiers in Psychology, 11, 521451. https://doi.org/10.3389/fpsyg.2020.01457
Yang, F. Y., & Wang, H. Y. (2023). Tracking visual attention during learning of complex science concepts with augmented 3D visualizations. Computers & Education, 193, 104659. https://doi.org/10.1016/j.compedu.2022.104659
Yang, H., Cai, M., Diao, Y., Liu, R., Liu, L., & Xiang, Q. (2023). How does interactive virtual reality enhance learning outcomes via emotional experiences? A structural equation modeling approach. Frontiers in Psychology, 13, 1081372. https://doi.org/10.3389/FPSYG.2022.1081372
Yohannes, A., & Chen, H. L. (2023). GeoGebra in mathematics education: A systematic review of journal articles published from 2010 to 2020. Interactive Learning Environments, 31(9), 5682–5697. https://doi.org/10.1080/10494820.2021.2016861
Ziatdinov, R., & Valles, J. R. (2022). Synthesis of modeling, visualization, and programming in geogebra as an effective approach for teaching and learning stem topics. Mathematics, 10(3), 398. https://doi.org/10.3390/math10030398